Which NBA Statistical Categories Mean the Most?
Is winning percentage the most likely indicator of playoff performance? How effective are the Four Factors in determining a game’s outcome?

Decades ago, my research showed that an NBA team’s road record and point differential foretold a team’s strength or weakness better than its winning percentage. The difference was slight, but it meant that at the end of the regular season, teams with a better record away from home and/or a higher average margin of victory had the best chance of advancing in the playoffs.
This was in bygone days, namely the period from the 1981-82 through 1992-93 seasons. At that time, squads with these advantages won more than three-quarters of their playoff series. Other categories also were solid, and a couple were less reliable, as the chart shows.
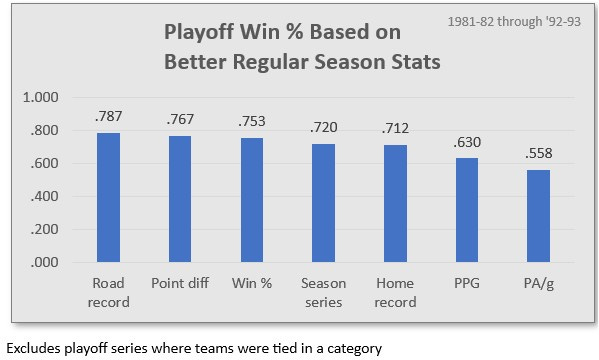
The top two categories made sense – the best teams on average performed better in front of opposing crowds, often a factor in the outcome of playoff games, and they also won their games by higher margins. In fact, in seven of those 12 seasons, the regular season leader in average margin of victory also won the NBA championship[1]. In the other five years, the leader advanced to the conference finals.
But is the same true in today’s game over 30 years later? So, I ran the numbers with current information, keeping the same categories as the prior study while adding a few new ones: offensive, defensive and net ratings (points per 100 possessions).
The updated results are below.
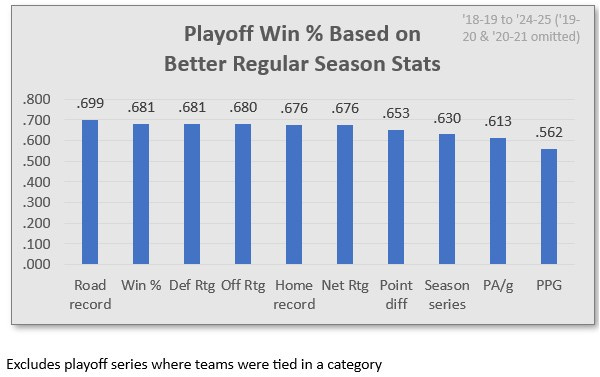
The chart shows that things have changed a little. The overall percentages are lower than they were in the ‘80s and ‘90s. While five areas originally had win rates of 71% and above, in recent years none are that high. For instance, a better road record and winning a season series both have dropped about nine percentage points.
Still, over the past six NBA regular seasons[1], road record still ranks first. Clubs with a better record in games away from home have won 70% of playoff series. And point differential, ranked second decades ago, has fallen to fourth in importance among the same categories originally assessed.
A touch below road record are clubs with better offensive, defensive or net ratings, a better winning percentage or better home mark. All come in at about 68%.
The outcome of regular season games between two playoff combatants has less to do with playoff success. And points scored and allowed per game are further off the mark. I omitted series where teams had identical regular season stats. This significantly affected only the season series category. When we factor in ties, only 45% of teams that won a season series also won the playoff matchup.
The data’s effect on this season
With roughly 30% of the current regular season left, what do the results say about the coming playoffs? Taking the updated percentages into account, here are a few observations based on games through the all-star break.
· Since the team with the top road record is the best indicator, Oklahoma City would seem to be in position to successfully defend its title. The Thunder have the league’s top mark, at 20-7 (.741), a game ahead of Denver’s 20-9 (.690) record. Be aware, however, that after the hot start, OKC is 8-6 in away games in the past two months.
· Detroit has the league’s top winning percentage, a half-game better than OKC.
· The Thunder have the top net rating, at +11.6, with a significant gap between them and the second-place Pistons (though OKC ranks fourth since Dec. 13).
· Detroit has the league’s best home record (22-6), a game ahead of the Knicks and a game and a half ahead of the Thunder.
· OKC is the only team in the top five in both O-Rating (fourth) and D-Rating (first). Five others are in the top 10 in both categories: Boston, New York, Houston, Minnesota, and San Antonio.
Four Factors and winning indicators
In the process of looking at the data over the past several years, I switched gears from regular season averages and totals to single-game performance. Which areas are more predictive of success in any given game?
The subject of winning indicators has been explored in different ways over the years, notably by Dean Oliver. As you likely know, Dean is responsible for basketball’s Four Factors: the statistical areas most aligned with winning teams. His work showed that effective field goal percentage and rates of turnovers, offensive rebounds, and free throws combine to form a very strong indicator of NBA team strength.
The Factors were a progressive measure of winning teams when Oliver designated them as crucial in his influential book, Basketball on Paper: Rules and Tools for Performance Analysis (Potomac Books, 2004). They have become part of analytics lexicon, abounding in discussions and in stat tables by the NBA, Basketball Reference, and other prominent hoops data sites.
In the intervening years, they have been joined by an analytics explosion – a profusion of new ways to look at the game. These sometimes operate on the theory that everything that can be measured should be measured – in other words, not always enlightening. But mostly, the proliferation of statistical methods available today, which are the byproduct of curiosity, ingenuity, and technology, has expanded greatly the bounds of our basketball knowledge.
However, the Four Factors really remain most prominent because they denote basic basketball logic: efficient shooting, buoyed by rebounding your misses, minimizing giveaways, and getting to the free throw line are the recipe for winning basketball.
How powerful is this combination? It is overwhelming. Over the past four seasons, when a team outdoes its opponent in all four areas in the same regular season game, they win virtually every time. The win rate is 99.7%. In 332 applicable games, the Factors are 331-1, with an average margin of 20.5 ppg[2].
The year-by-year percentages since 2022-23:
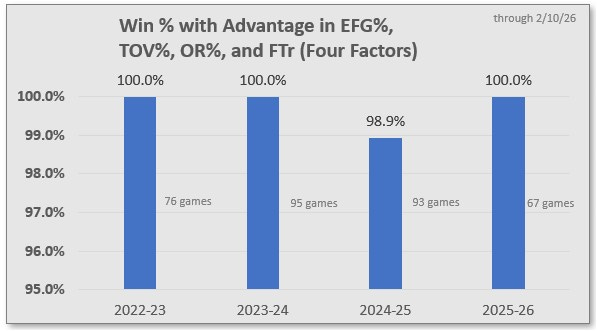
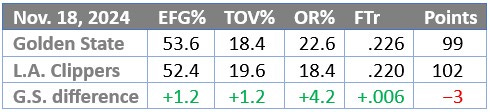
The exception to perfection – the only game in which the Factors did not hold up – was early in the 2024-25 season when the home-standing Clippers beat Golden State by three points, with the Warriors having a slight edge in all four categories. The Warriors only led for 1:16 in the contest, but they rallied from nine down in the final four minutes, losing only when Curry and Payton II both missed three-pointers, with 12 and two seconds left. But what really sunk Golden State was going 9-19 at the foul line[1]. The Four Factors data for the game:
Of course, a team seldom “wins” all areas in the same game; this has occurred in only 7.4% of regular season games since 2022-23.
It is more common for a club to have an edge in three of four categories, something that has occurred in 65% of all games in the same span. However, which three stats provide the edge makes a difference. With an advantage in effective FG%, turnover %, and offensive rebounding %, teams have won 82% of the time since ’22-23. The two other combinations also are reliable, but a little less so, as the chart shows.
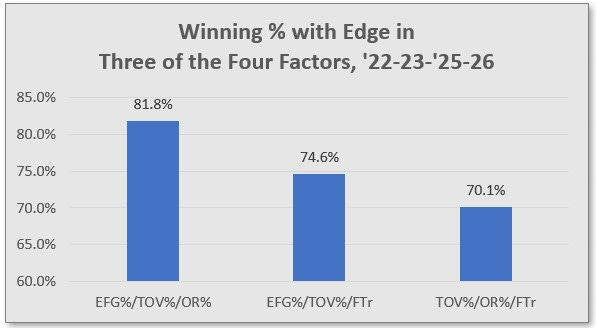
The implication supports the accepted fact that shooting efficiency outweighs the other three categories while the rate of turnovers, offensive boards and free throws are about even in importance.
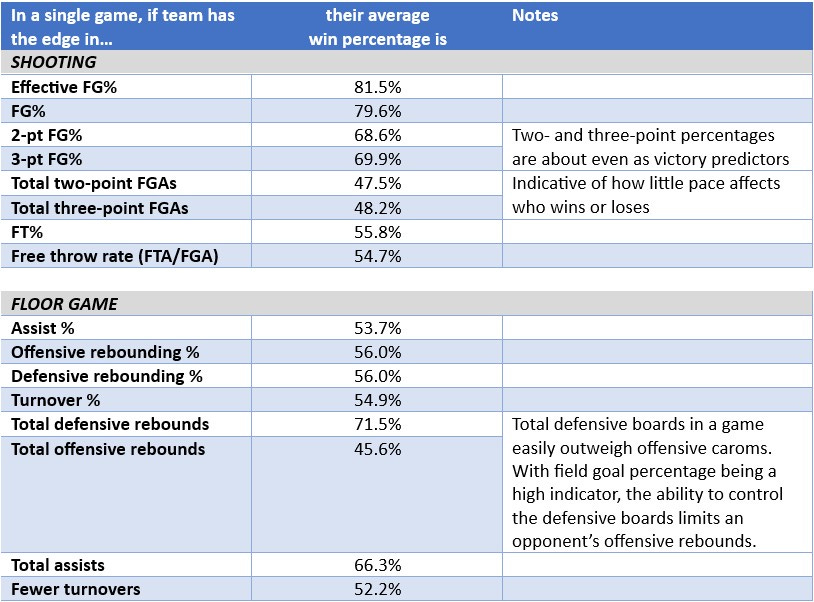
Looking at each category individually, a team with a higher EFG% percentage than its opponent wins 81.5% of the time – regardless of how they do in all other categories. If they have an OR% advantage, they win 56.0% of the time. Lower turnover percentage? 54.9%. Higher free throw rate? 54.7%.
Thus, the weights (importance) for each factor since ’22-23 are:
EFG% 33.0%
OR% 22. 7%
TOV% 22.2%
FTr 22.1%
Winning percentages in other categories
In closing, if you are curious about how the major statistical areas relate to winning percentage, here are percentages when we judge each category individually.
[1] For free throw rate, I use free throw attempts divided by field goal attempts. If we use the alternate method, free throws made divided by field goals attempted, the Clippers have the edge, .195 to .107.
[1] 2018-19 through 2024-25, omitting the pandemic-affected seasons of 2019-20 and 2020-21.
[2] The opposite is true as well: the competition is 1-331, based on opponent’s EFG%, opponent’s TOV%, etc.
[1] This was during the Magic-Bird-Jordan era.